The EU’s Enlargement as an Unsung Catch-up Story
The pattern of macroeconomic catch-up seen in the EU’s enlargement process is a remarkably positive story - if largely unsung and still incomplete. The catch-up achieved so far constitutes a key backdrop to today’s debate about further enlargement. Without the rapid growth of the most recently acceding states it would be impossible for the EU to contemplate taking further poor members.
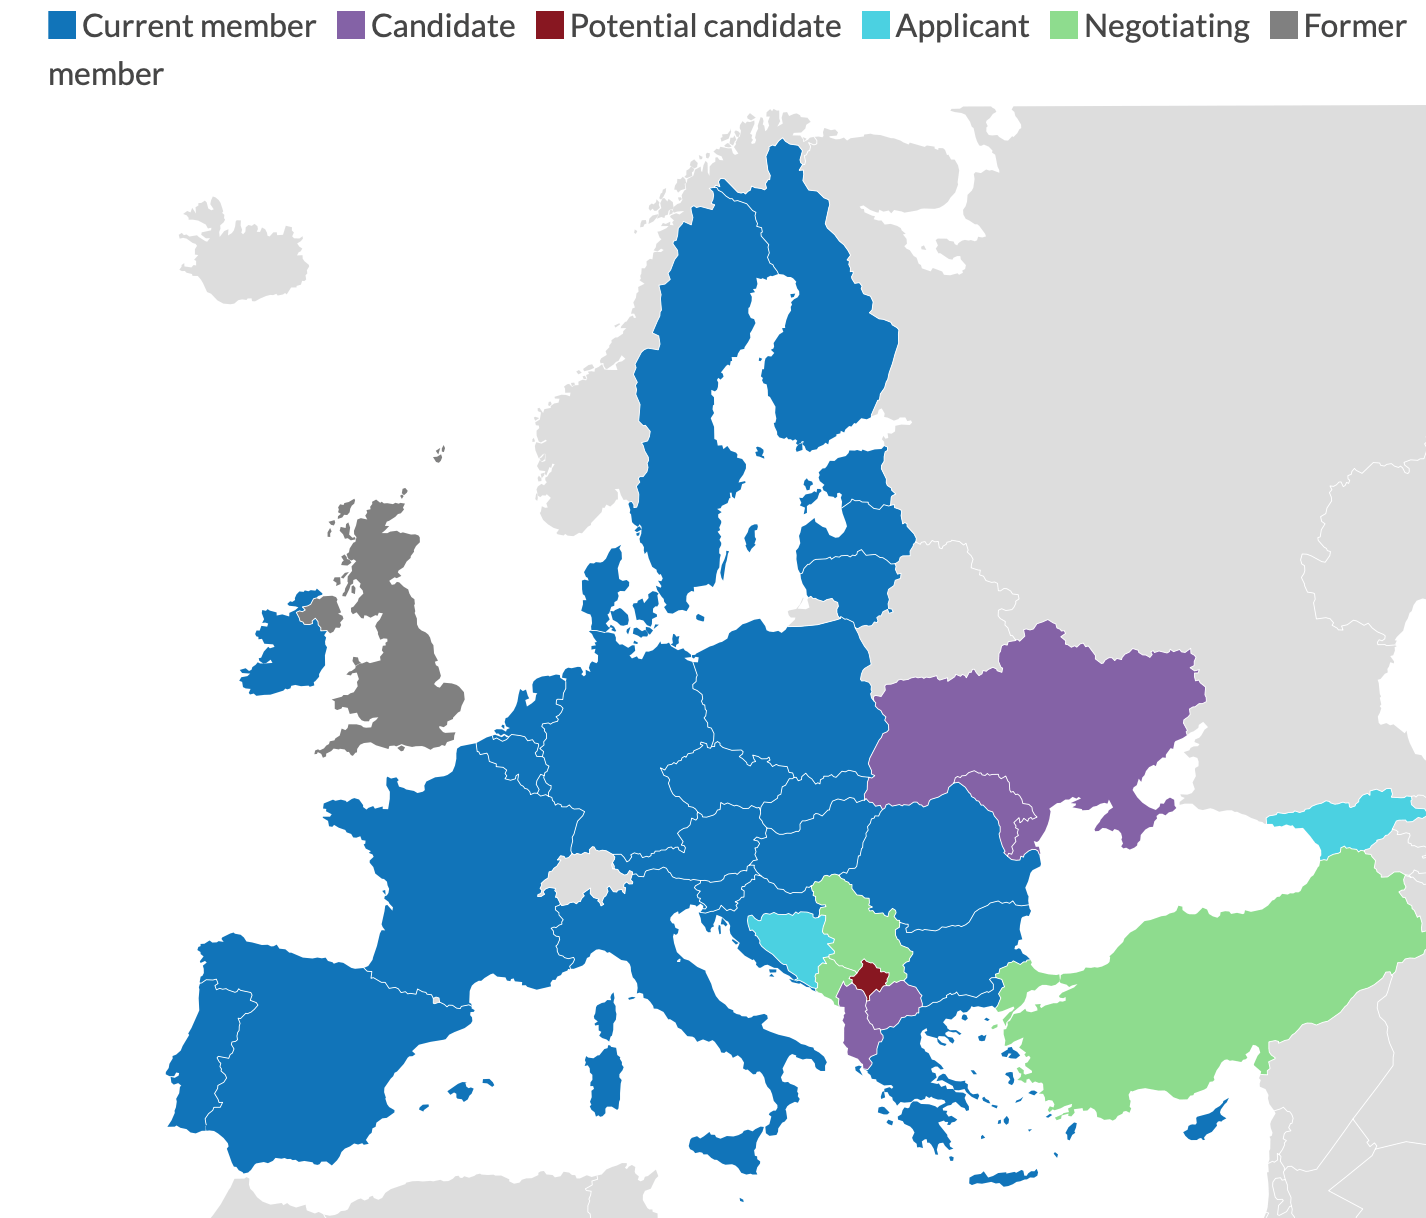
Credit for the map: GIS
The pattern of macroeconomic catch-up seen in the EU’s enlargement process is a remarkably positive story - if largely unsung and still incomplete. The catch-up achieved so far constitutes a key backdrop to today’s debate about further enlargement. Without the rapid growth of the most recently acceding states it would be impossible for the EU to contemplate taking further poor members.
The evidence of catch-up
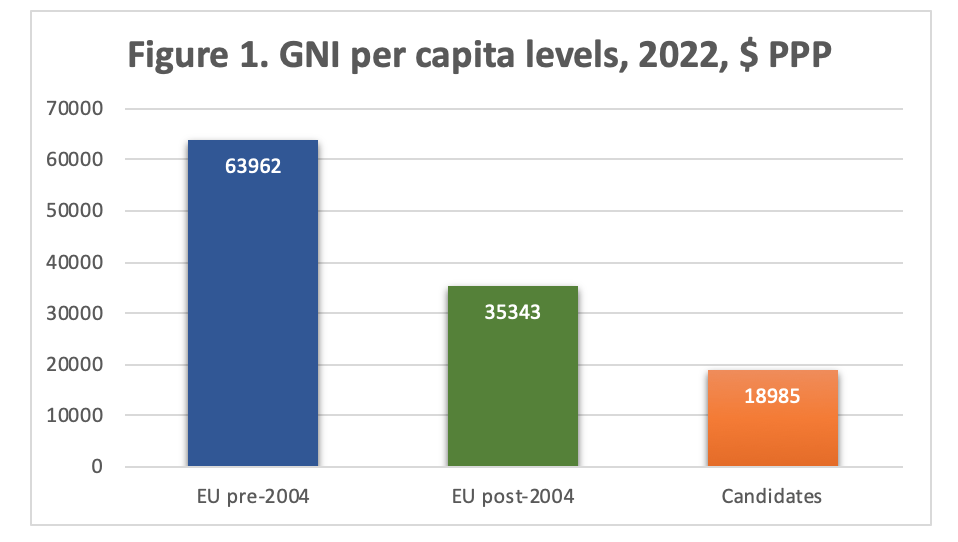
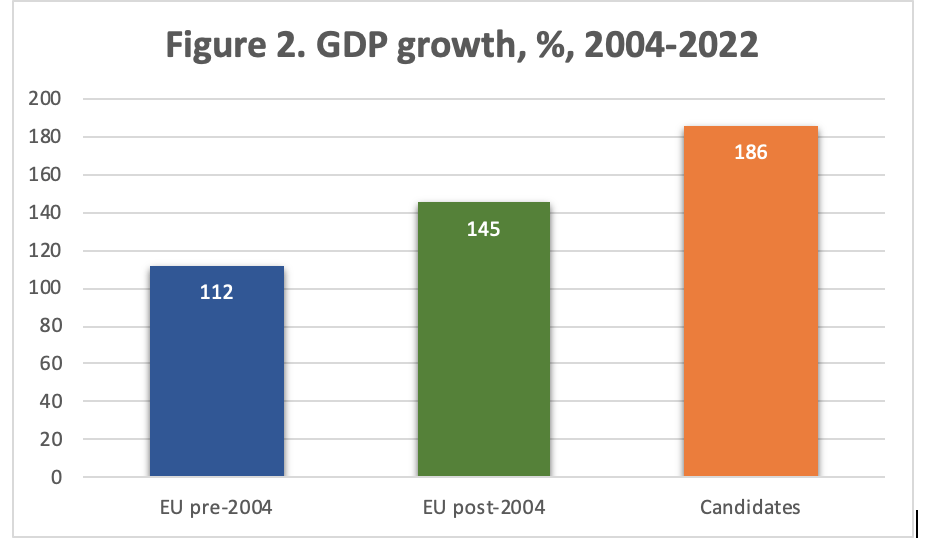
Countries are presented in three groups, as pre-2004 member states, post-2004 member states, and current candidate/applicant states, The data are reporting respectively GNI per capita levels in 2022, and GDP growth rates over the period 2004 to 2022 (see Figures 1 and 2)
Regarding current GNI levels there is a remarkable clarity in their hierarchy, with the three groups appearing in the order that one might expect, with the older member states first, the newer member states second, and the candidate states third (Table 1).
The only departure from this notional order is seen in two older, southern member states – Greece and Portugal – ranked now among the middle of the newer member states.
Bringing in macroeconomic growth rates since the big 2004 enlargement, and recalling also the 2003 "Thessalonika Declaration" where the EU pledged further enlargement with the Balkans, the story is even more remarkable. The pattern of results in Table 2 is a mirror image of the first table with GNI per capital levels. This is the catch-up story.
The newer member states have all been growing faster than the older member states. The only two small exceptions (Ireland and Luxembourg) are due to statistical quirks relating to income shifting by multinational enterprises. The candidate states have in turn on average been growing faster than the post-2004 acceding states.
The big outlier from this pattern is Ukraine, which is both the poorest country and experienced only slow growth until 2021, followed in 2022 by huge economic losses suffered in the current war with Russia. The prospects for a fast catch-up here in a post-war scenario is favoured by the relatively high level of the population’s education, and notably its next generation to enter the labour force, which is more advanced than any other accession candidate (OECD/PISA results). This of course would have to rely on a large return of the present Ukrainian refugees hosted in the EU.
Whether this broad catch-up narrative is solid can be tested with some counter-arguments.
A first one can suggest that the real story is one of failure of the old Europe to grow faster. To be sure, the growth record of the Mediterranean states of old Europe is poor, especially Italy with a mediocre performance now for decades and even more so Greece which is still recovering from the losses incurred during its euro crisis of a decade ago. However, for the bulk of old Europe the story seems rather to be one of their economies maturing at quite high income levels, and where societal objectives have tended to become less about economic growth and more about the quality of the environment and health care, and migration-related concerns. The EU average GDP per capita in PPP terms has in fact grown approximately at the same rate as the US, whose demographic growth accounts for the higher commonly quoted growth rates.
A second argument is that the catch-up process is less explained by the EU accession process and more about the formerly communist economies of central, eastern and southeastern Europe recovering naturally from the gross inefficiencies of the communist economic regimes. This argument has weight, especially for countries such as the Czech Republic and Slovakia that had well-established industrial cultures before the communist period, and for the Baltic states with their long Hanseatic trading heritage. However, taken on its own this argument fails to take into account the synergies between the politics of re-joining democratic Europe and the economics of integration with the single market. The other post-Soviet countries in central Asia have not converged despite their strong endowment with raw materials.
A third argument is that while the Balkan states have been growing relatively fast, their accession prospects have become less credible. Regarding formal accession procedures this may be true, but de facto all the Western Balkan states have now become entirely encircled by the EU and considerably integrated already with it economically, especially with the movements of its diaspora into the EU and often back.
A further question is how far these trends since 2004 should be expected to continue. Naïve extrapolation past growth rates would see Estonia reach the GNI per capita of France (itself close to the EU-27 average) in the early 2030s. Conventional growth theory would suggest however, that growth rates tend to taper off asymptotically as income levels rise towards the levels of the mature advanced economies.
While the positive catch-up trend is welcome both the Commission and Western Balkan states would like the candidate states to grow faster, as reflected in the ‘Growth Plan’ for the Western Balkans proposed alongside the Commission’s ‘Enlargement Package’ published last November. This initiative proposes considerable additional financial incentives conditional on specified reforms, and should become a growth accelerator.
Successful also compared to other world regions
This apparent success story for the EU and the wider Europe is underlined by comparisons that may be made with other world regions (Figures 3 and 4). An interesting comparison here is between on the one hand the EU and its new member states and accession candidates, and, on the other hand, the US in relation to its closest southern neighbours - thus Mexico compared to Turkey, and the five Central American republics compared to the six Western Balkan states.
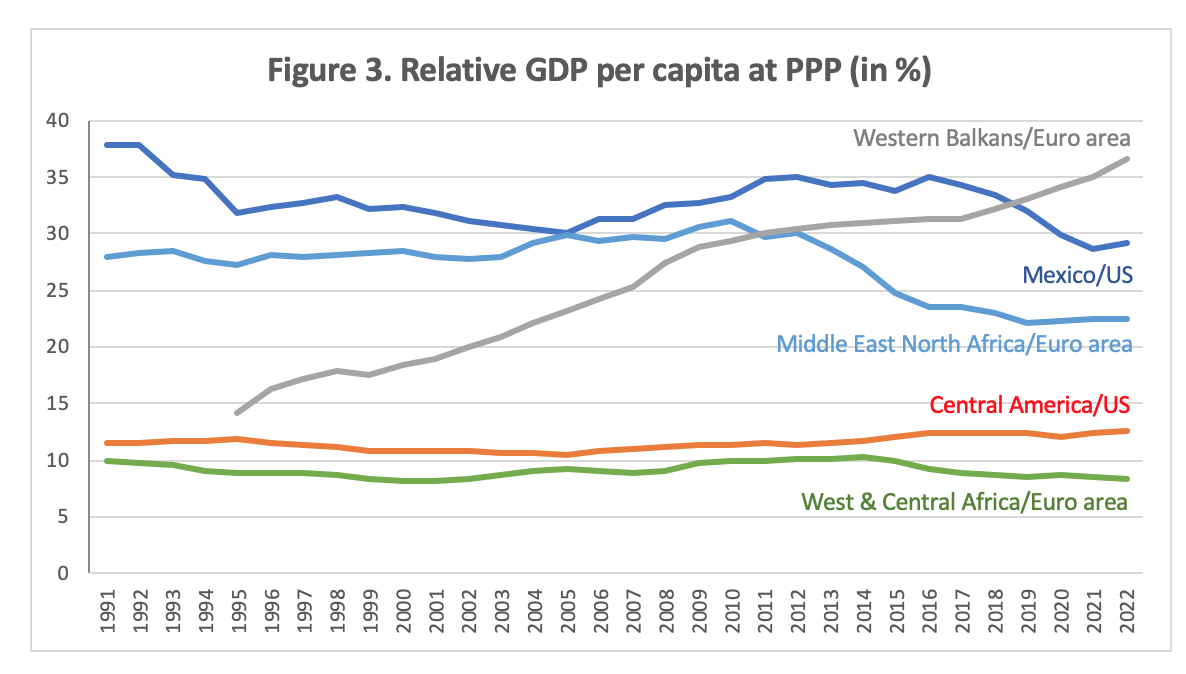
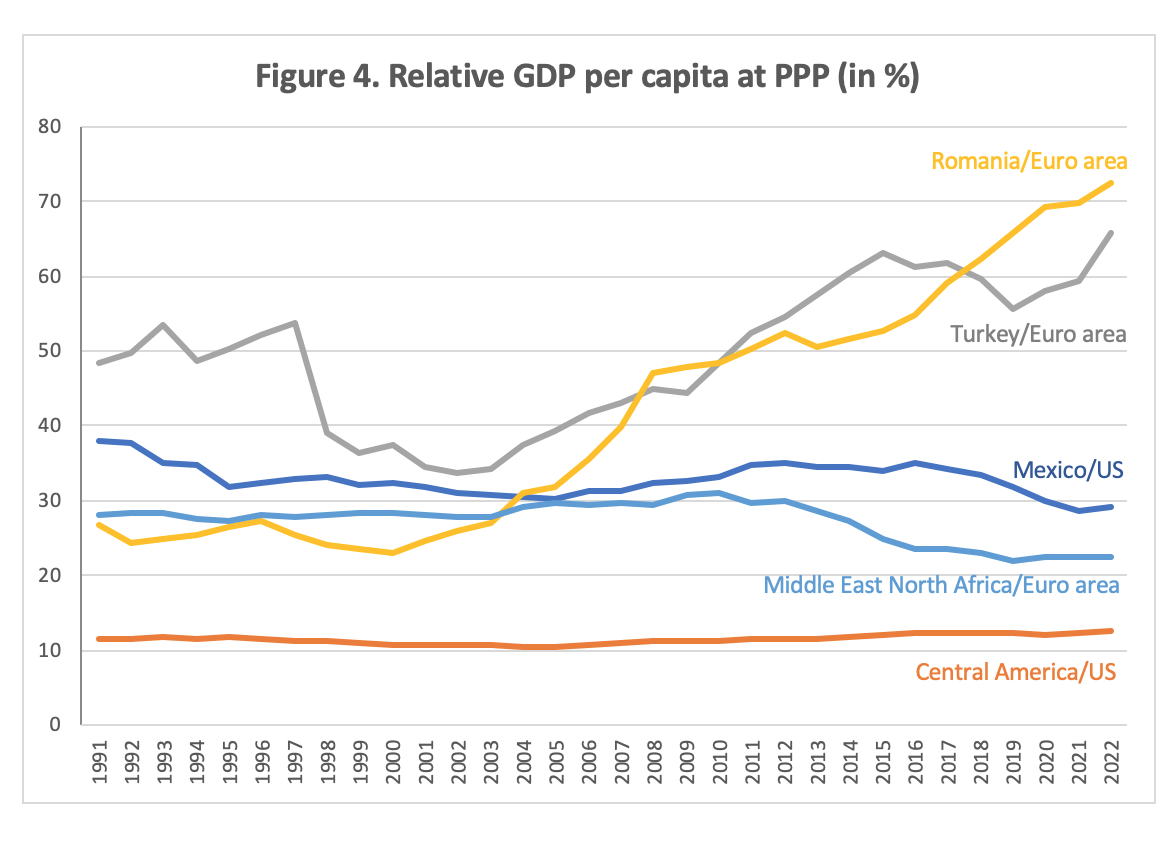
Mexico and the Central American states have failed to catch up at all with the US, whereas the EU’s new member states, such as Romania, the Western Balkans and Turkey have all been significantly catching up with the old EU (represented in the Figures by Eurozone states).
The reasons for this divergent experience are no doubt complex, and involve cultural and historical factors. Yet there is one major objective difference between the stories of these two continental hegemons and their respective neighbours: the EU and its neighbours have an integration strategy, whereas the US has none such with its neighbors except for a thin Central American Free Trade Area (CAFTA) and the deeper NAFTA with Mexico, which however was diluted under the Trump presidency.
Much of South and East Asia has been catching up fast with the world’s most advanced economies, but this is not otherwise reported here because the focus here has been on comparisons between the respective neighbourhoods of the EU and US.
As often it is the dog that did not bark that is the most interesting part of the story. When the EU was contemplating enlarging to the (then much) poorer countries of Central Europe the main fears were about permanent migratory pressure and low wage competition. These fears have now dissipated as migration towards the old Member States has practically stopped. This is in stark contrast with the continuing political problems in the US with immigration from Mexico and Central America.
The same applies to Turkey, from where there are an increasing number of people asking for political asylum, but with no broad-based economic pressure for economic migration given the sharp improvement in living standards there.
Europe’s problems with migration are much more related to the failure of the North African region to converge. Sub-Saharan Africa has also made no progress and remains at a similar level as Central America relative to the US.
Conclusion
The positive catch-up story in the European neighbourhood comes through clearly at two levels. First, in the wider Europe the hierarchy of GNI income levels and growth rates in the three levels between pre-2004 EU member states, post-2004 member states, and candidate states is coherent. Growth rates are inversely related to income levels, with the poorer states growing faster than the richer ones.
Second, while this positive story may seem quite natural, it becomes more remarkable when observing that it is not seen in the Americas, nor for Europe with regard to its non-European neighbours in the Middle East or Africa.
A key explanatory difference may well be that while the EU leads a regional integration process, albeit with much-debated limitations, the US has no comparable regional strategy. This success provides an unspoken, but indispensable backdrop that has made discussions about further enlargements possible.
s
1. GNI per capita, 2022, $
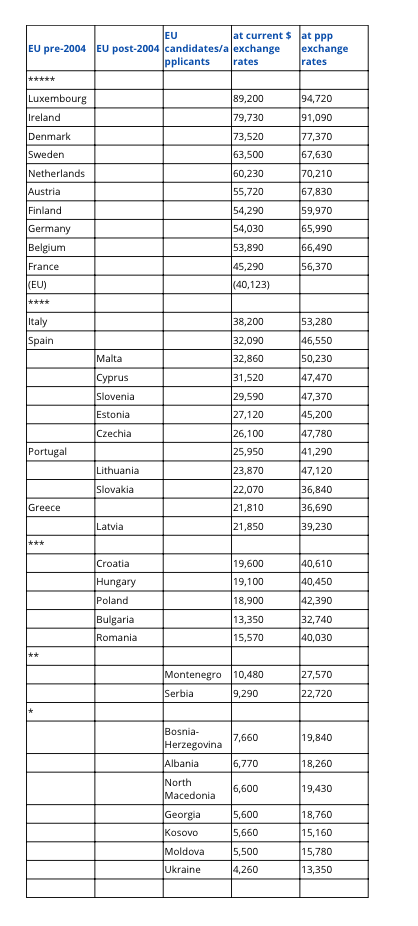
Source: data.worldbank.org. Note: the ranking under one to five stars in Tables 1 and 2 is to roughly mark out the different categories of achievement.
Table 2. GDP growth from 2004 to 2022
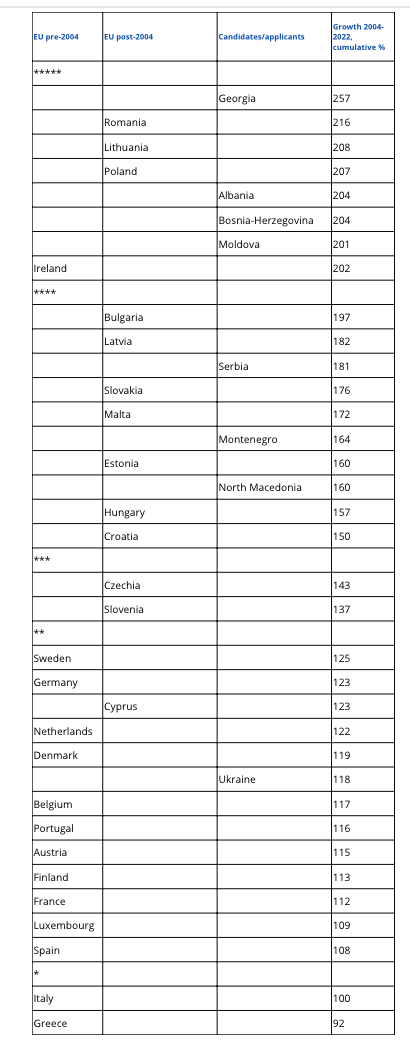
Source: own calculations on basis of https://data.worldbank.org/indicator/NY.GDP.PCAP.PP.CD Note: for Ukraine the data is for 2004 to 2021. Due to the war losses the index for 2022 fell to 60.
IEP@BU does not express opinions of its own. The opinions expressed in this publication are those of the authors. Any errors or omissions are the responsibility of the authors.
