The EU Miracle: When 75 Million Reach High Income
There is a large positive effect of new membership to the EU without cost to previous members. The EU enlargement seems to be a positive sum game.

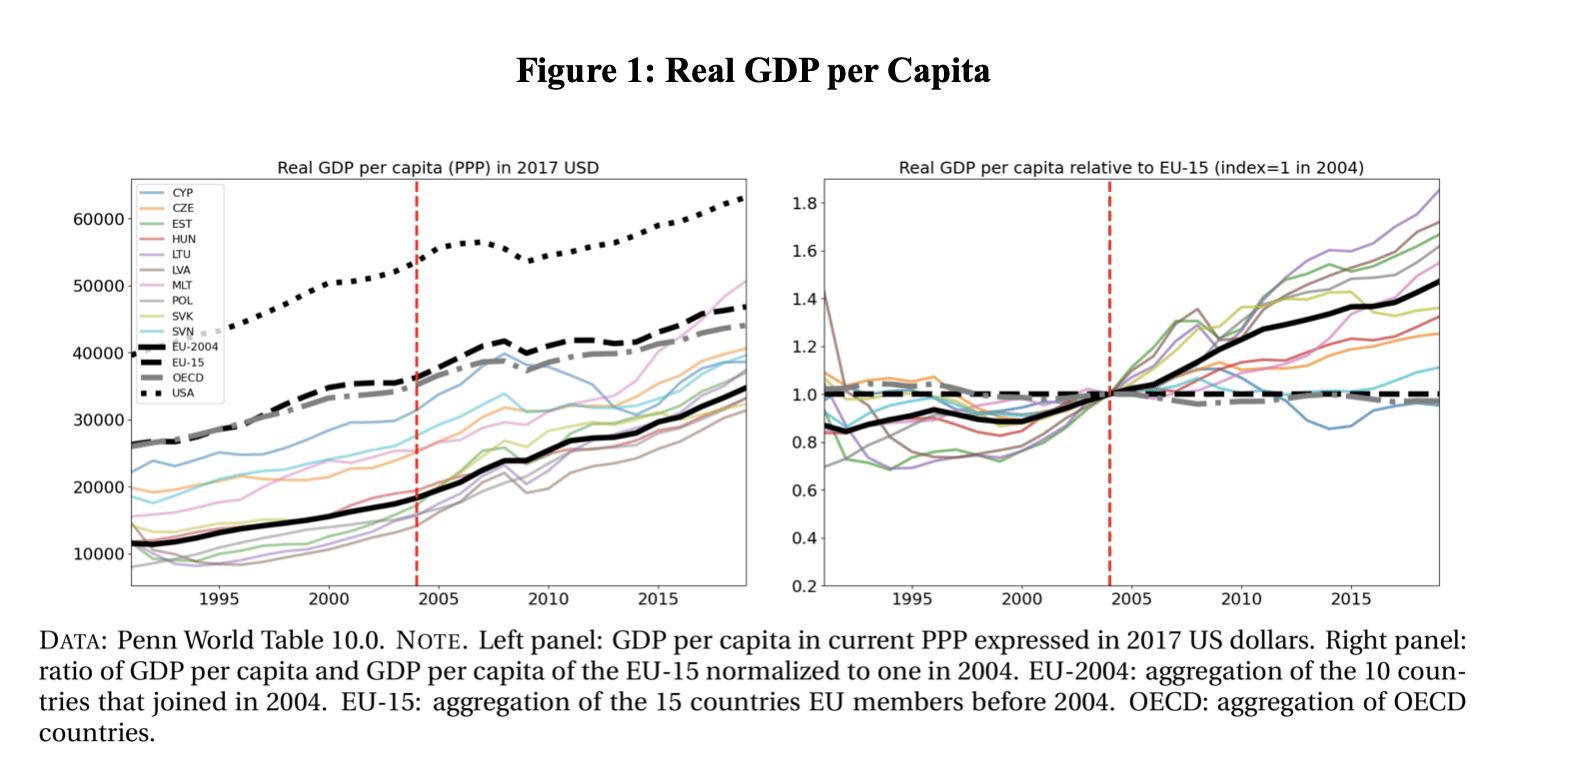
The European Union, founded in 1957, aims to bring peace and prosperity to territories that have experienced war for at least eleven centuries. In May 2004, 75 million people across 10 countries (Cyprus, Czech Republic, Estonia, Hungary, Latvia, Lithuania, Malta, Poland, Slovakia, and Slovenia) have become members of the European Union (EU). Between 2004 and 2019, the gross domestic product (GDP) per capita of these countries almost doubled from 18,314 USD to 34,753 USD. GDP per capita is the most common measure of standard of living: it gives the revenue that an average inhabitant receives each year. When measured in real terms it corrects for inflation. According to the World Bank that use this measure, 8 of the 10 countries that joined the EU in 2004 were in the middle-income group in 2004 (except for Cyprus and Malta) while they are now in the high-income group.
Was part of this economic miracle the result of the adhesion to the EU? What is the effect of this enlargement on the 15 already EU members in 2004? What are the main driver of this miracle? In this note, based on recent research, I tried to answer these questions.

In the paper “The EU Miracle: When 75 Million Reach High Income”, I examine the effect of the EU enlargement on two aggregated economies: the EU-2004, which includes the new member states that joined the European Union in 2004, and the EU-15, which consists of the member states prior to the 2004 enlargement. Figure 1 shows the GDP per capita for the EU-2004, EU-15 and a few select countries in level on the left panel, and relative to the EU-15 on the right panel. From this figure, GDP per capita is growing for both the EU-15 and the EU-2004. Furthermore, GDP per capita before 2004 seems to be constant relative to the EU-15 while it is growing after 2004. The EU-2004 seems to catch-up in their standard of living with the EU-15 after 2004.
Challenge and Methodology
The challenge to evaluate the role of the EU on the GDP per capital of both the EU-2004 and the EU-15 is that there are no obvious control group. Indeed, to evaluate the causal impact of a policy change, researchers usually compare the outcome of the treated group, those subject to the policy change, with a control group that was not subject to the policy change. Ideally, the treated and control group have identical characteristics. If the treatment group is doing better than the control group, it indicates that there is a causal effect of the policy change on the outcome. In the case of the 2004 EU enlargement, there are no countries similar to the EU-2004 that did not join the EU that could be used as control. Similarly there are no EU-15 that did not experiment an enlargement.
In the paper, I used a methodology that can address this identification challenge: the synthetic control method introduced by Abadie and Gardeazabal (2003). The idea is to construct a so-called synthetic control as the weighted average of some countries not affected by the EU enlargement taken from what is called a donor pool. The weighted are chosen such that the dynamics of the treated country, the EU-2004 or the EU-15, and the synthetic control is the same before 2004. If there was a causal effect of the EU enlargement in 2004, then the GDP per capita of the treated country will differs from the one of its synthetic control.
Main Results
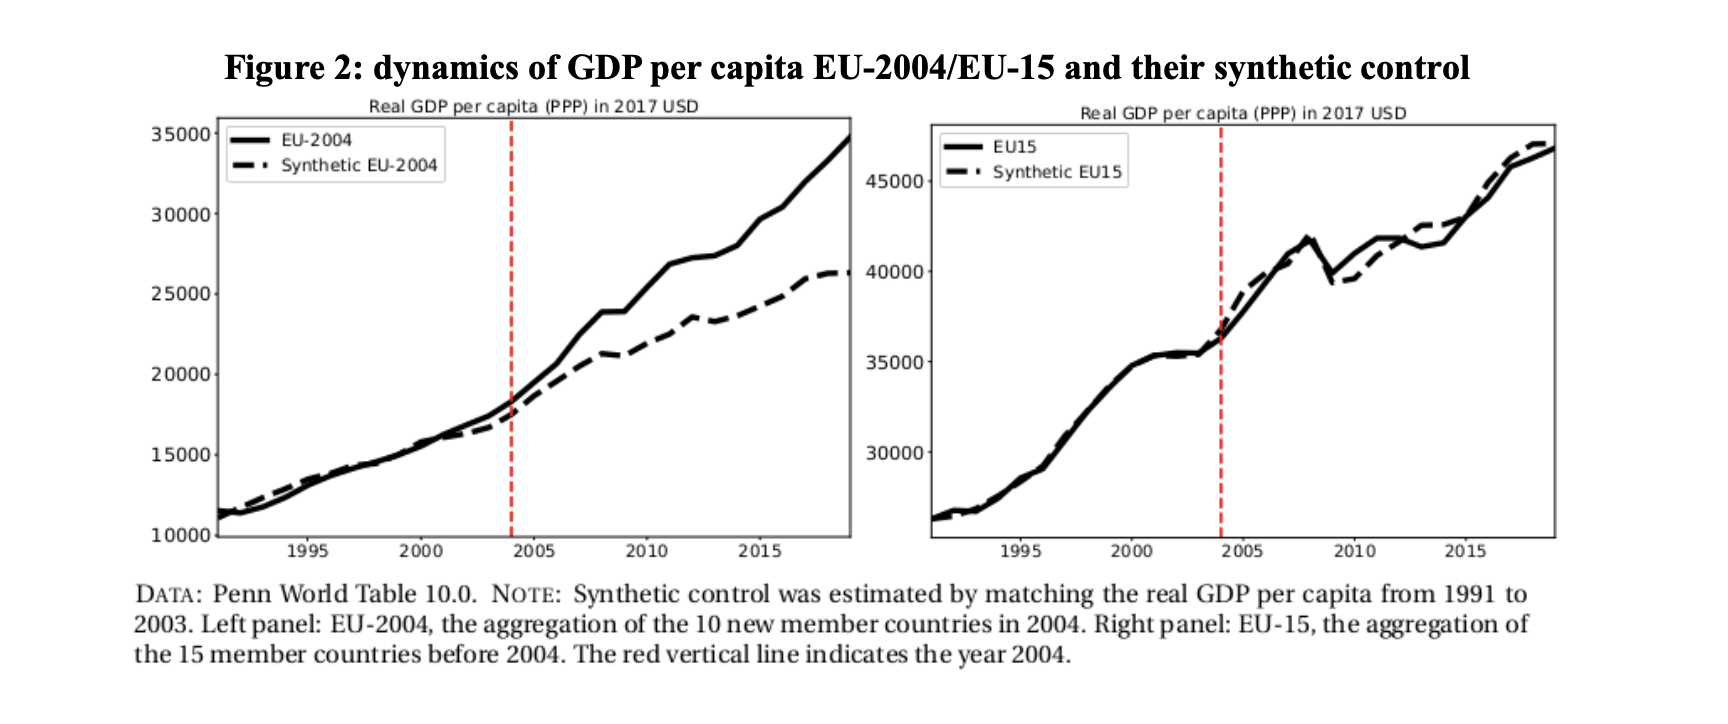
Figure 2 plots GDP per capita of the EU-2004 (left) and the EU-15 (right), and their respective synthetic control. According to these calculations, the difference between the EU-2004 and its synthetic control is 8,433 USD in 2019. The adhesion of these countries to the EU in 2004 led to an increase of their GDP per capita of 32%. Almost a third of their current level of standard or living can be attributed to their adhesion to the EU. About half of the increase in GDP per capita between 2004 and 2019 is due to the EU. This is a very large positive effect due to changes in policies, regulation, trade barrier, etc.
A similar calculation for the EU-15 does not point toward a large positive or negative effect. As the right panel of Figure 2 shows, the dynamics of the GDP per capita of the EU-15 closely follows the dynamics of its synthetic control.

As shown in the paper, these results are robust to a variety of tests, such that a leave-one-out test, in-time placebo, in-country placebo, alternative donor pools and alternative specifications. Across these tests, the large and positive effect of the EU adhesion on GDP per capita for the new members states is always present. For the EU-15, these robustness checks are consistent with an absence of effect of the 2004 enlargement.
The EU enlargement in the 2004 was remarkably beneficial to the new members states while being at no cost to the previous members.

IEP@BU does not express opinions of its own. The opinions expressed in this publication are those of the authors. Any errors or omissions are the responsibility of the authors.

In May 2004, 75 million people across 10 countries have become members of the EU. Between 2004 and 2019, the GDP per capita of these countries almost doubled from 18,314 USD to 34,753 USD
