Is the EU Natural Gas Price Cap Effective?
The current EU natural gas price cap on gas does not lower TTF volatility, fails to prevent price spikes, and has no significant impact on lowering inflation and commodity market volatility.

The Title Transfer Facility (TTF) is a virtual platform for natural gas contracts in the Netherlands and it serves as the primary benchmark for European gas and energy prices. The TTF gained prominence on the global stage when Russia's decision to cut gas deliveries to Europe, amid its invasion of Ukraine, sent gas prices soaring to unprecedented levels.
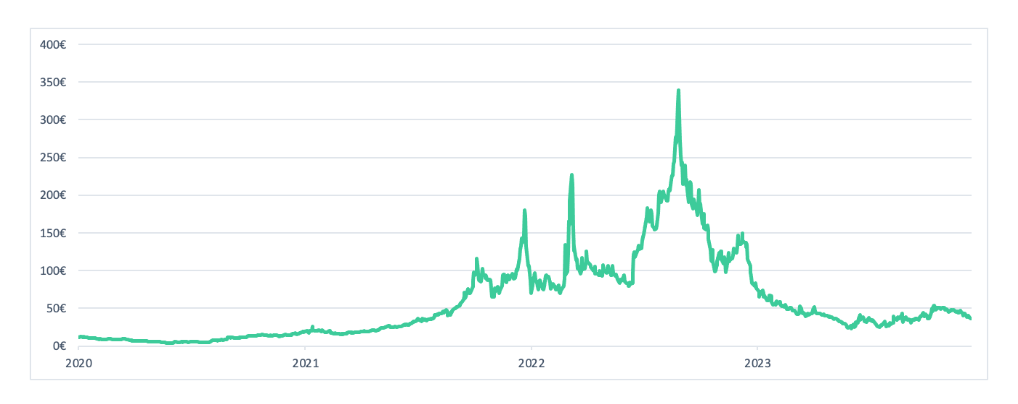
Figure 1: Historical Price of Dutch TTF Gas Monthly Near Term (NDEX EUR/mwh).
In response to the energy price crisis, the European Commission took decisive action on October 18th, 2022, by proposing emergency measures. Instead of implementing an immediate cap on gas prices, the Commission sought approval to draft a proposal for a temporary "maximum dynamic price" at the Title Transfer Facility Dutch gas hub. This measure, considered a last resort, aimed to prevent further strain on Europe's gas demand.
On December 20th, 2022, the European Union introduced the proposed regulation implementing a temporary gas price cap at the Title Transfer Facility. The cap was set to take effect from February 15th, 2023, and to remain in place for one year.
How does the cap work?
The current European Union gas price cap automatically activates in response to two specific market conditions that must be met concurrently:
-
Exceeding a Fixed Threshold: The month-ahead price on the TTF surpasses 180 EUR/MWh for three consecutive working days.
-
Divergence from LNG Benchmark: The month-ahead price on the Title Transfer Facility exceeds the reference price for Liquefied Natural Gas (LNG) on global markets by 35 EUR for the same three working days.
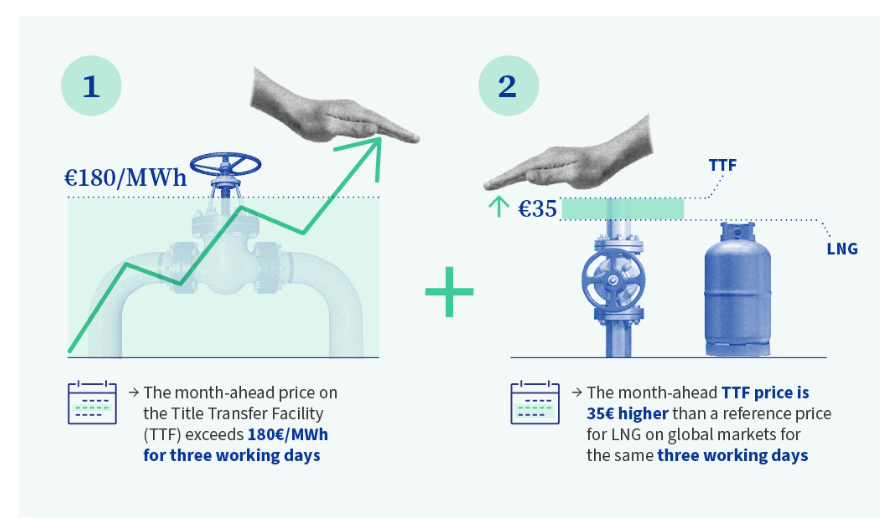
Figure 2: Market event triggering the activation of the mechanism, source: Infographic - A market mechanism to limit excessive gas price spikes, European Council.
The gas price regulation sets a "dynamic bidding limit" prohibiting transactions above it. The proposal also introduces a method for determining the LNG reference price, emphasizing the importance of using benchmarks that reflect global gas price trends.
The Effectiveness of the Gas Price Cap
Since the introduction of the gas price cap, energy prices have consistently trended downward throughout the year, especially given the relatively mild winter of 2022-2023. The increase in LNG imports, accompanied by the expansion of infrastructure, has played a crucial role in fostering this favorable development. By November 2023, Europe's gas storage levels had surpassed 90% of capacity, meeting the target.
However, currently, a debate surrounds the gas cap.
-
Persistent Price Challenges. Despite the cap's implementation, gas prices persist at a significant 50% above their pre-invasion long-run average. This raises questions about the long-term impact of the Russian-Ukrainian war and the effectiveness of the temporary cap in addressing enduring market dynamics.
-
Vulnerability to LNG Volatility. The increased reliance on LNG imports exposes Europe to short-term price fluctuations. Following a Hamas attack on October 7th, 2023, the TTF price experienced a sudden and substantial increase, surging over 40% from 38.23 EUR/mwh to 53.98 EUR/mwh in just five days. This surge was prompted by reports of Egypt's gas imports dropping to zero, as Egypt plays a crucial role as an importer of gas from Israel and a supplier of LNG to Europe.
-
Ongoing Russian Dependency. Efforts to diversify energy sources notwithstanding, the European Union is projected to acquire approximately 22 billion cubic meters of gas from Russia this year. A substantial portion of this supply traverses through Ukraine, a route that faces increasing threats due to the ongoing conflict. The precarious nature of this dependency raises questions about the resilience of Europe's energy security strategy. In fact, Russia reported doubled revenues from gas and oil in October 2023.
In response to these challenges, on December 19th, 2023, the European Council agreed to extend emergency measures until January 31st, 2025. A senior EU official, speaking anonymously to Reuters, stated, "Our analysis has been that it would be justified to extend these regimes into next year and continue to benefit from the protection they give us from any potential price spikes on the market." The question arises: Is the gas price cap effective in preventing high market volatility and price spikes? The ongoing debate underscores the need for a thorough assessment of the cap's impact on Europe's energy landscape.
Our Analysis
To explore the effectiveness of the price cap mechanisms, we inspect the Title Transfer Facility (TTF) front-month price and investigate the effects of different price cap mechanisms on price and volatility dynamics for major international commodities and equity indices. Over the period from July 2013 to October 2023, we analyze the interconnections between European natural gas, commodities, global and local equity indices, also assessing the mitigation effects on price. Specifically, we compare three distinct price cap mechanisms (scenarios) for the TTF gas market and contrast them with a no-price intervention (Baseline scenario). The 3 alternatives are the following:
-
Institutional Price Cap, which replicates the regulatory framework currently in place.
-
Fixed Price Cap, through which the TTF price cannot exceed a specified price threshold.
-
Dynamic Price Cap, designed to constrain the TTF volatility to be consistent with its long-term average.
First, we model price and volatility for all commodities and equity returns in-sample over the period from July 10th, 2013 to October 18th, 2022, when the European Commission announced the gas price cap mechanism.
Second, we run an out-of-sample analysis over the period from October 19th, 2022 to October 18th, 2023 providing ex-ante estimation of the potential market impacts of the alternative price cap mechanisms. We do this by relying on a sophisticated historical simulation method (Filtered Historical Simulation – FHS), which accounts implicitly for the interdependency across commodities and equity returns. Assuming that one of the price caps is in force, means that from the total number of out-of-sample simulations (15000), we excluded paths that did not comply to the cap.

Figure 3: Simulated Price of Dutch TTF Gas Monthly Near Term (NDEX EUR/mwh) with different price caps, FHS (Filtered Historical Simulations) refers to the simulation method. The red dashed line is the first quartile, the black line is the median and the pink dashed line is the third quartile.
In Figure 3 we report the simulated TTF gas price from October 19th, 2022 to October 18th, 2023, as going back to October 18th, 2022 and ask what the price of gas could be under different price cap regimes. The figure also depicts confidence bounds: the larger the confidence bounds, the greater the expected price volatility. Notable differences emerge:
-
Under the Baseline scenario, the unrestricted TTF gas price is expected to remain high and volatile.
-
Under the Fixed Price Cap scenario, the TTF gas price consistently stays below the cap (set at approximately 106 EUR/mwh), resulting in consistently lower volatility compared to the baseline.
-
The Institutional Price Cap closely resembles the baseline in both price and volatility, with only a slight decrease in the upper limit of the confidence interval.
-
Under the Dynamic Price Cap scenario, TTF gas shows both lower price and volatility compared to the baseline and institutional scenarios, yet higher than the fixed price cap.
As the European Commission aims to moderate market volatility and inflation, we assessed the impact of the different caps on the commodity market. Our findings demonstrate that the Institutional cap has the least difference from the baseline scenario. The actual values (ex-post values obtained over the simulation period) confirm our findings.
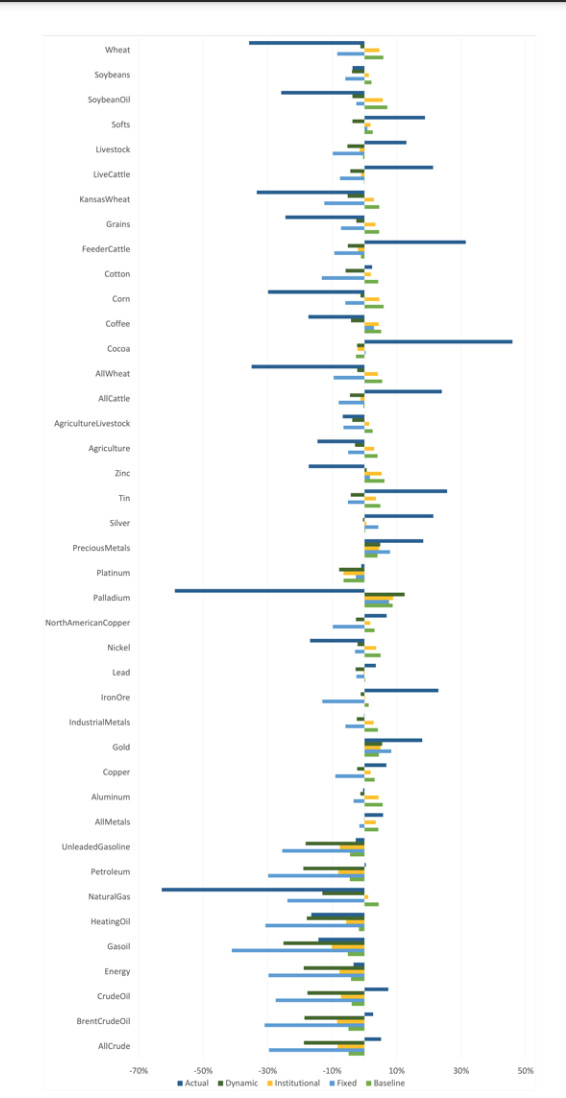
Figure 4: Representation of returns (Oct 18th, 2022 - Oct 18th, 2023) computed on broad price indices for commodity market. The Actual values depict effective returns post one year, while Dynamic, Fixed, and Baseline show returns linked to their respective assumptions.
Findings about the caps can be summarized as follows:
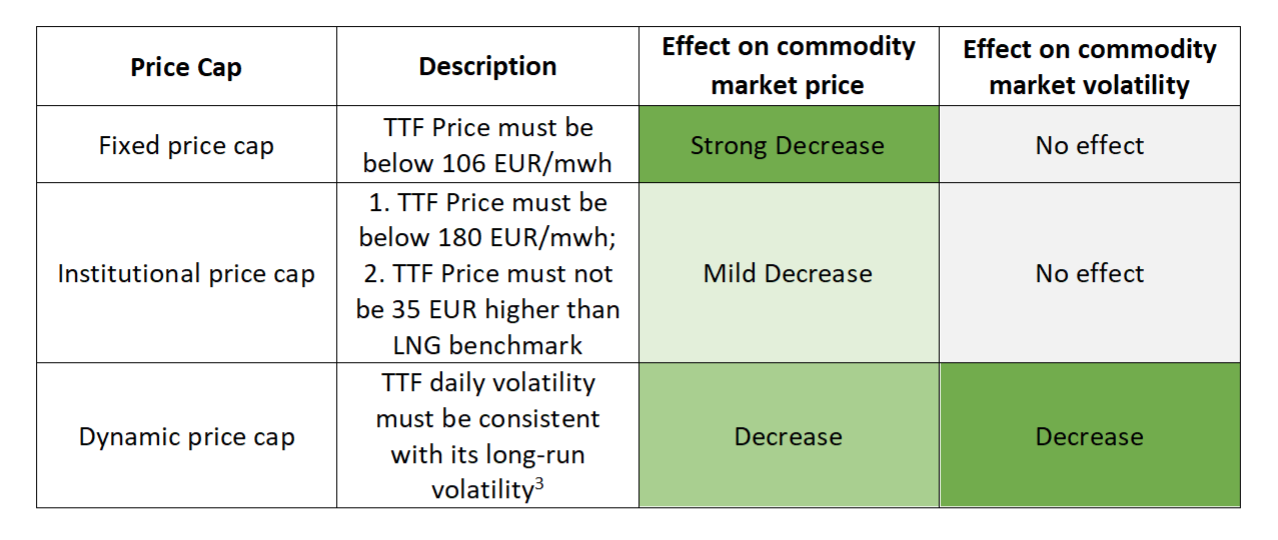
In our study, we found that implementing price caps significantly impacts returns and volatility for several country equity indices, including the UK, France, Italy, Canada, and Spain.
In this context, we observed that the Institutional cap had the least difference from the baseline scenario with no cap. Specifically:
-
The fixed price cap appears to have a negative impact on both the prices (decreases) and the volatility (increases) of the equity indices compared to the baseline scenario.
-
The Institutional price cap seems not to affect the equity market and is similar to the baseline scenario.
-
The Dynamic price cap negatively affects equity returns (though the decreases are smaller than with the fixed price cap), and the equity market volatility reduces compared to the no-cap scenario.
Market volatility is expected to increase for Italy, Russia, Canada, and Spain with the Fixed price cap compared to the Baseline scenario. In contrast, the Dynamic Price Cap is associated with lower market volatility for Global, Europe, USA, China, Germany, UK, France, Russia, and Canada, but with worsened returns for France, UK, and Canada.
Two main factors may influence equity returns:
-
Changes in gas prices impact future cash flows for firms, either positively or negatively, depending on whether gas is a cost or revenue factor for them. This factor may affect countries differently, with some benefiting from higher gas prices (e.g., China) and others facing increased costs (e.g., UK, France, Italy, Canada, and Spain).
-
Gas price increases could influence discount rates through expected inflation and real interest rates, which, in turn, affect stock returns. High inflation rates might lead to higher discount rates and lower stock prices.
Our findings suggest that the current cap in force in force seems to play a minor role in containing potential price spikes also having virtually no impact in mitigating volatility. It does not lower TTF volatility, fails to prevent price spikes, and has no significant impact on lowering inflation and commodity market volatility.
Instead, a price cap focused on volatility dynamics may help reduce market turbulence and potentially reduce stock market volatility. Therefore, rather than relying solely on specific price caps, a mechanism based on volatility dynamics could be more effective in preventing market disruptions and mitigating their effects on other commodities and stock markets.
IEP@BU does not express opinions of its own. The opinions expressed in this publication are those of the authors. Any errors or omissions are the responsibility of the authors.
